注釈
Go to the end to download the full example code.
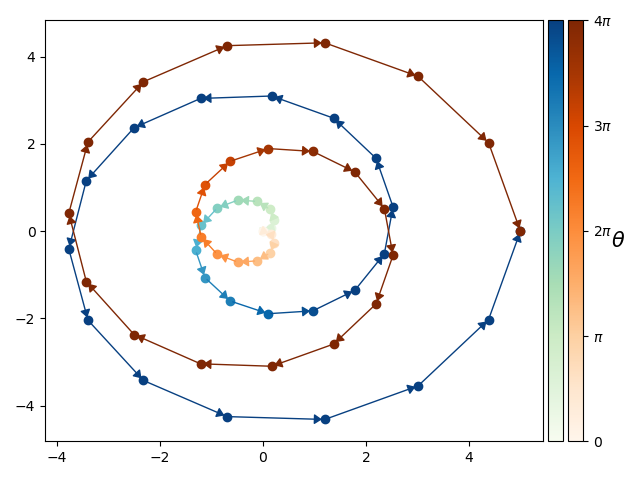
colored parametric plot#
import numpy as np
import matplotlib.pyplot as plt
from matplotlib.patches import FancyArrowPatch, ArrowStyle
from matplotlib.cm import ScalarMappable
from matplotlib.colors import Normalize
from mpl_toolkits.axes_grid1 import make_axes_locatable

def plot(fac, z, cmap, norm):
    fig, ax, cax = fac
    arrs = []
    for i, (x, y) in enumerate(zip(z.real, z.imag)):
        c = cmap(norm(i))
        ax.scatter(x, y, color = c)

        if i !=0:
            style = ArrowStyle('-|>', head_length=0.3)
            arr = FancyArrowPatch((x0, y0), (x, y),
                                  arrowstyle=style,
                                  mutation_scale=15,
                                  color=c, lw=1)
            arrs.append(arr)

        x0 = np.copy(x)
        y0 = np.copy(y)

    sm = ScalarMappable(norm=norm, cmap=cmap)
    sm.set_array([])
    cbar = fig.colorbar(sm, cax=cax)

    for arr in arrs:
        ax.add_patch(arr)
    return cbar

fig, ax = plt.subplots(1,1)

divider = make_axes_locatable(ax)

cax1 = divider.append_axes("right", size="3%", pad=0.05)
cax2 = divider.append_axes("right", size="3%", pad=0.05)

sample = 30

theta = np.linspace(0, 4*np.pi, sample)
r = np.linspace(0, 5, sample)
z1 = r*np.exp(1.j*theta)
z2 = r*np.exp(-1.j*theta)

norm = Normalize(vmin=theta[0], vmax=theta[-1])

cbar1 = plot([fig,ax, cax1], z1, plt.cm.GnBu, norm)
cbar2 = plot([fig,ax, cax2], z2, plt.cm.Oranges, norm)

cbar1.set_ticks([])
cbar2.set_ticks([0, np.pi, 2*np.pi, 3*np.pi, 4*np.pi])
cbar2.set_ticklabels(["$0$", "$\pi$", "$2\pi$", "$3\pi$", "$4\pi$"])
cbar2.set_label(r"$\theta$", fontsize=15)
cbar2.ax.yaxis.label.set_rotation(0)

plt.tight_layout()
plt.show()
Total running time of the script: (0 minutes 0.353 seconds)