elasticsearch#
やんごとなき理由により某組織のネットワーク管理を予算ほぼゼロで保守する必要性があり, 数百のネットワーク機器のlogの収集・検索・可視化等を1箇所で行うため,Elastic社のElastic Stackのうちelasticsearchの運用の備忘録を残す. ChatGPTとかがない時代に試行錯誤して構築したので,最適化されていないと思うがデータフローの概念図はこんな感じ.
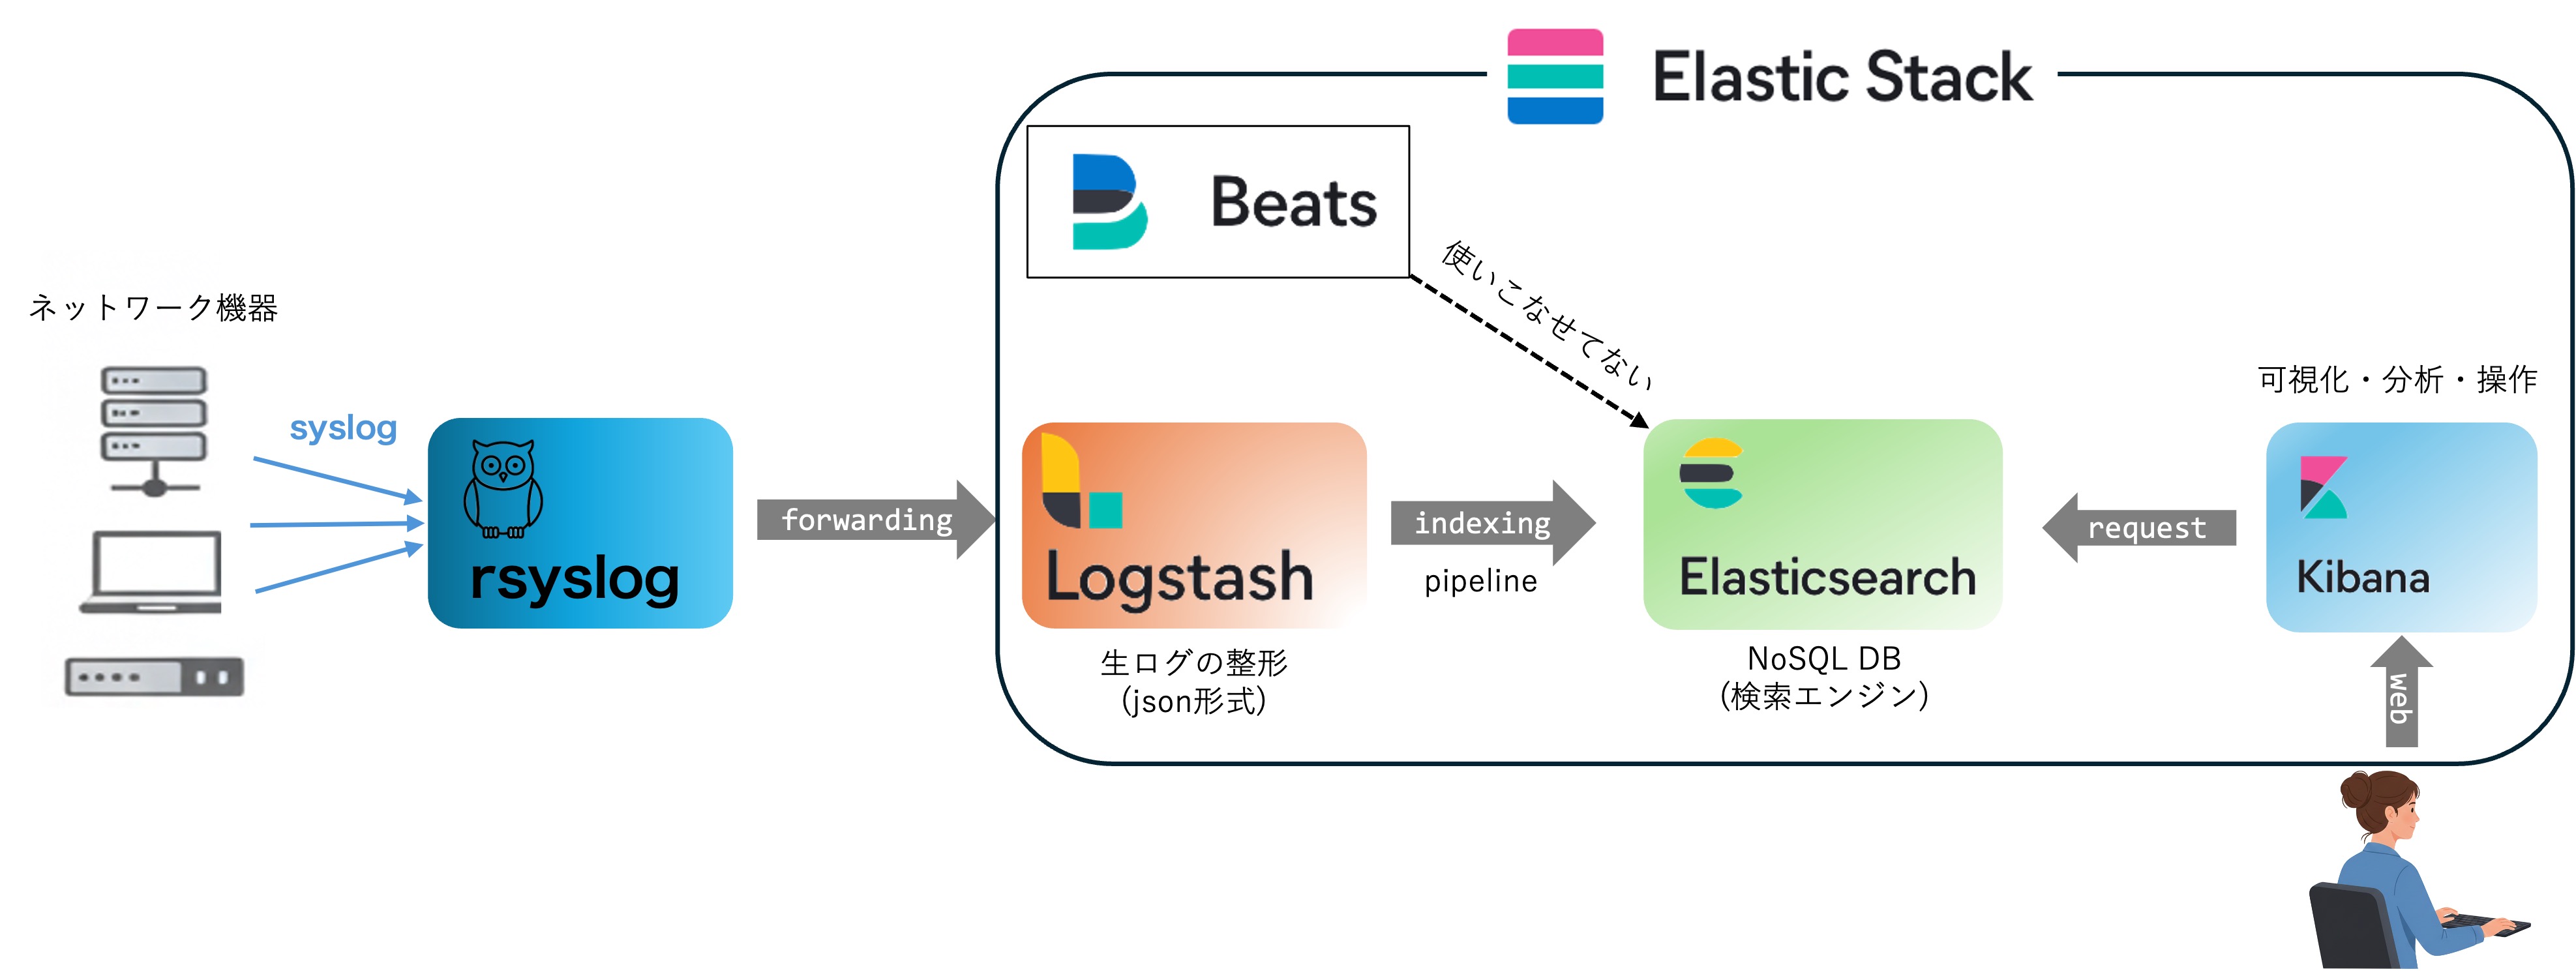
elasticstack全体が多機能なので使いこなせていないが,ログの収集・検索・可視化は上記の流れで実現可能.
elastic search installation#
Install Elasticsearch with Debian Packageを参考にinstallする.elasticsearchをinstallしたらlogstash, kibanaも一緒にインストールしておくと良いだろう.
# systemctl start elasticsearch
# systemctl enable elasticsearch
起動確認は
# curl -u elastic localhost:9200
Enter host password for user 'elastic':
...
デフォルトのuserは user:elastic pass:elastic
パスワードの変更は
# /usr/share/elasticsearch/bin/elasticsearch-setup-passwords interactive
で変更できる.
Set up basic security for the Elastic Stack より最低限のセキュリティーセットアップを実行.
version#
# curl -u <elastic_admin> -XGET 'http://localhost:9200'
Enter host password for user 'elastic':
{
  "name" : "xxxx",
  "cluster_name" : "elasticsearch",
  "cluster_uuid" : "-----",
  "version" : {
    "number" : "8.19.9",
    "build_flavor" : "default",
    "build_type" : "deb",
    "build_hash" : "f60dd5fdef48c4b6cf97721154cd49b3b4794fb0",
    "build_date" : "2025-12-16T22:07:42.115850075Z",
    "build_snapshot" : false,
    "lucene_version" : "9.12.2",
    "minimum_wire_compatibility_version" : "7.17.0",
    "minimum_index_compatibility_version" : "7.0.0"
  },
  "tagline" : "You Know, for Search"
}
データの保存先#
/etc/elasticsearch/elasticsearch.ymlで
# ----------------------------------- Paths ------------------------------------
#
# Path to directory where to store the data (separate multiple locations by comma):
#
#path.data: /var/lib/elasticsearch
path.data: /hddpool/elasticsearch
のようにすれば良い.
データの移行#
Migrating data を参考にすればdataの移行は可能だと思う.
Lucene indexの制限(現在非推奨)#
ファイヤーウォールのログをlogstash -> elasticsearch へ送る際に次の様なerrorが出ていた.
Could not index event to Elasticsearch. status: 400, action: (省略) \"reason\"=>\"Number of documents in the index can't exceed [2147483519]
どうやら,elasticsearchの一つのindexに対するdocumentとの登録上限があるようで概ね 2^31 = 2147483648 程度しか登録できないようだ.これはelasticsearchが使っているLucene indexの制約によるらしく現在もこの制約がある. まあ,一つのindexに対して登録されたドキュメントが膨大だと検索に時間がかかる様になるので仕方ないのかもしれない.
解決方法としてindexの名称を異なるものに変更すれば良いが,手動でlogstash.ymlを変更するのも面倒だし恒常的に監視していないので,半年毎などで自動でindex名称を変更するようにしても良いかもしれない. もしかするとlogstash側ですでにそのような機構が用意されているかもしれないがとりあえずは再indicesし始めたので,おいおい対策を考える.
# curl -u elastic "http://localhost:9200/_cat/indices?v"
で docs.countに登録ドキュメント量が記載されているので,これを定期的に確認して対処するしかないかな. ファイヤーウォールのlogが概ね30分で484541あるのでざっくり概算すると92日でdocument limitationに到達する.従って,indexは2ヶ月に1回程度の頻度で更新しないとダメだな.あるいはファイヤーウォールののindecing をやめるか. とりあえず,crontabに
00 6 1 */3 * /bin/bash /etc/logstash/conf.d/rename-index-mfwlog.sh
を追記して3ヶ月毎に1度indexの名前を更新する.
# curl -u elastic "http://localhost:9200/_cat/indices?h=h,s,i,id,p,r,dc,dd,ss,creation.date.string"
でindexを作成した日時がわかる.
DataStream#
cronでelasticsarchのindexを差し替えていたが,elasticsearch 7からdatastream + ILMロールオーバーで自動的にindexを更新してくれるようなので修正した.
output {
  elasticsearch {
    hosts => ["http://localhost:9200"]
    data_stream            => true
    data_stream_type       => "logs"    # 必須
    data_stream_dataset    => "***"     # 任意
  }
}
logrolloverの設定はkibanaのDev Toolで
GET _ilm/policy/logs
で確認できる.ここではデフォルトの "max_age": "30d", "max_primary_shard_size": "50gb" をそのまま使う.ファイヤーウォールのlogは概ね2日程度でロールオーバされる見込み.
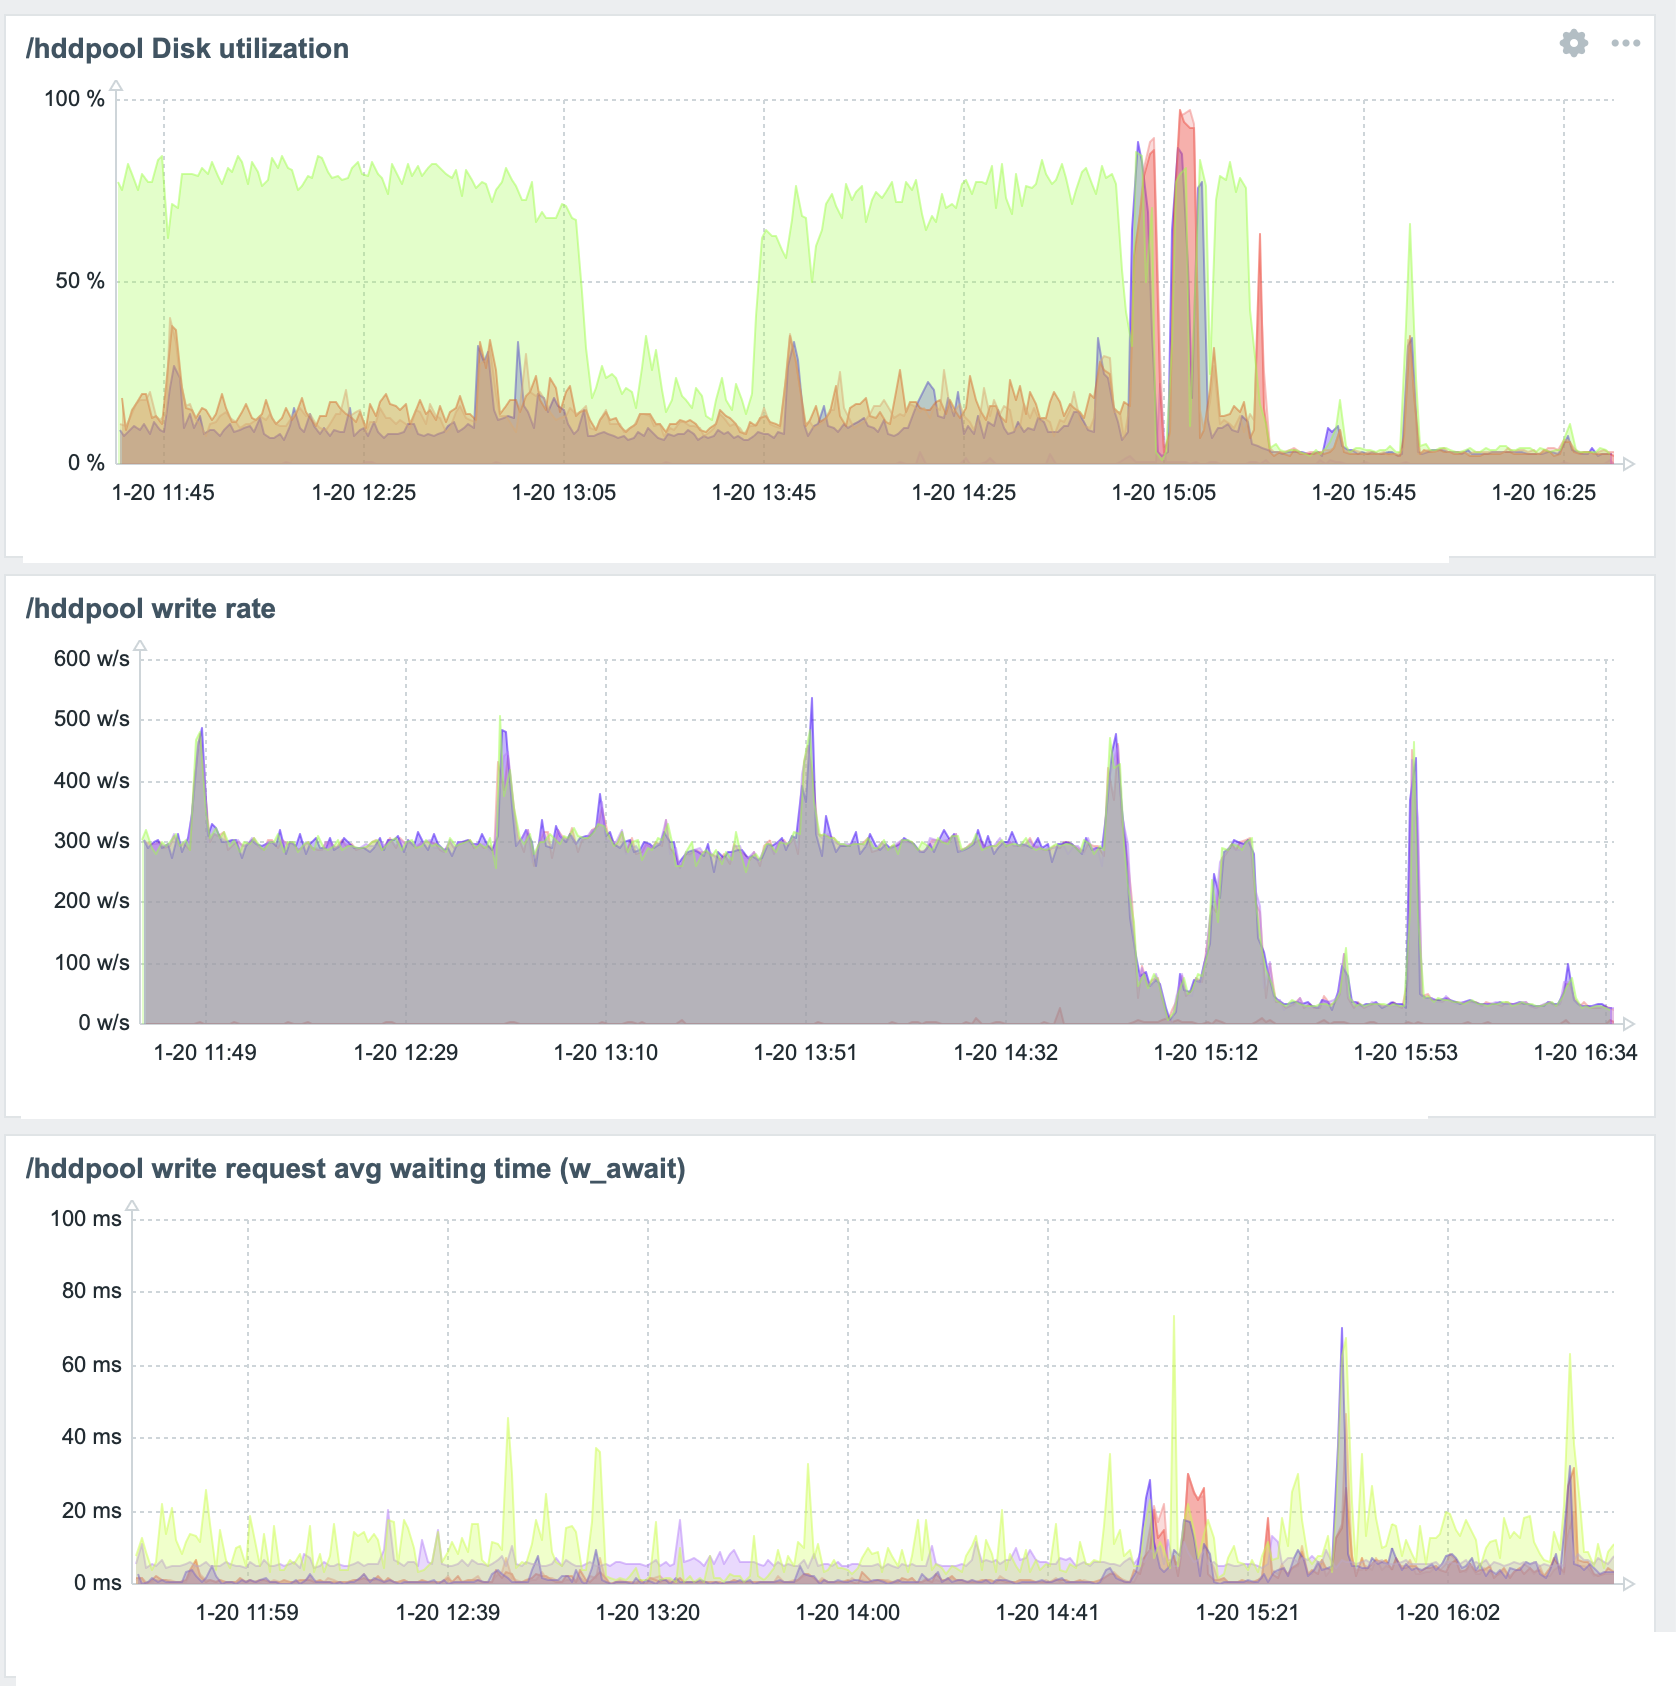
Disk書き込みの負荷軽減#
elasticsearchが原因で一つのディスクだけDiskUtilityが80%がを超える状態が恒常的に続いているので(参考), indexの更新頻度(refresh_interval)を60秒毎に変更,スレッド数を1に,非同期書き込みを60秒に1回に制限する.
# curl -u <elastic_admin> -X PUT "localhost:9200/_all/_settings" -H 'Content-Type: application/json' -d'
{
  "index" : {
    "refresh_interval" : "60s",
    "merge.scheduler.max_thread_count" : 1,
    "translog.durability": "async",
    "translog.sync_interval": "60s"
  }
}
'
こうかは ばつぐんだ!
と思ったが問題再燃.
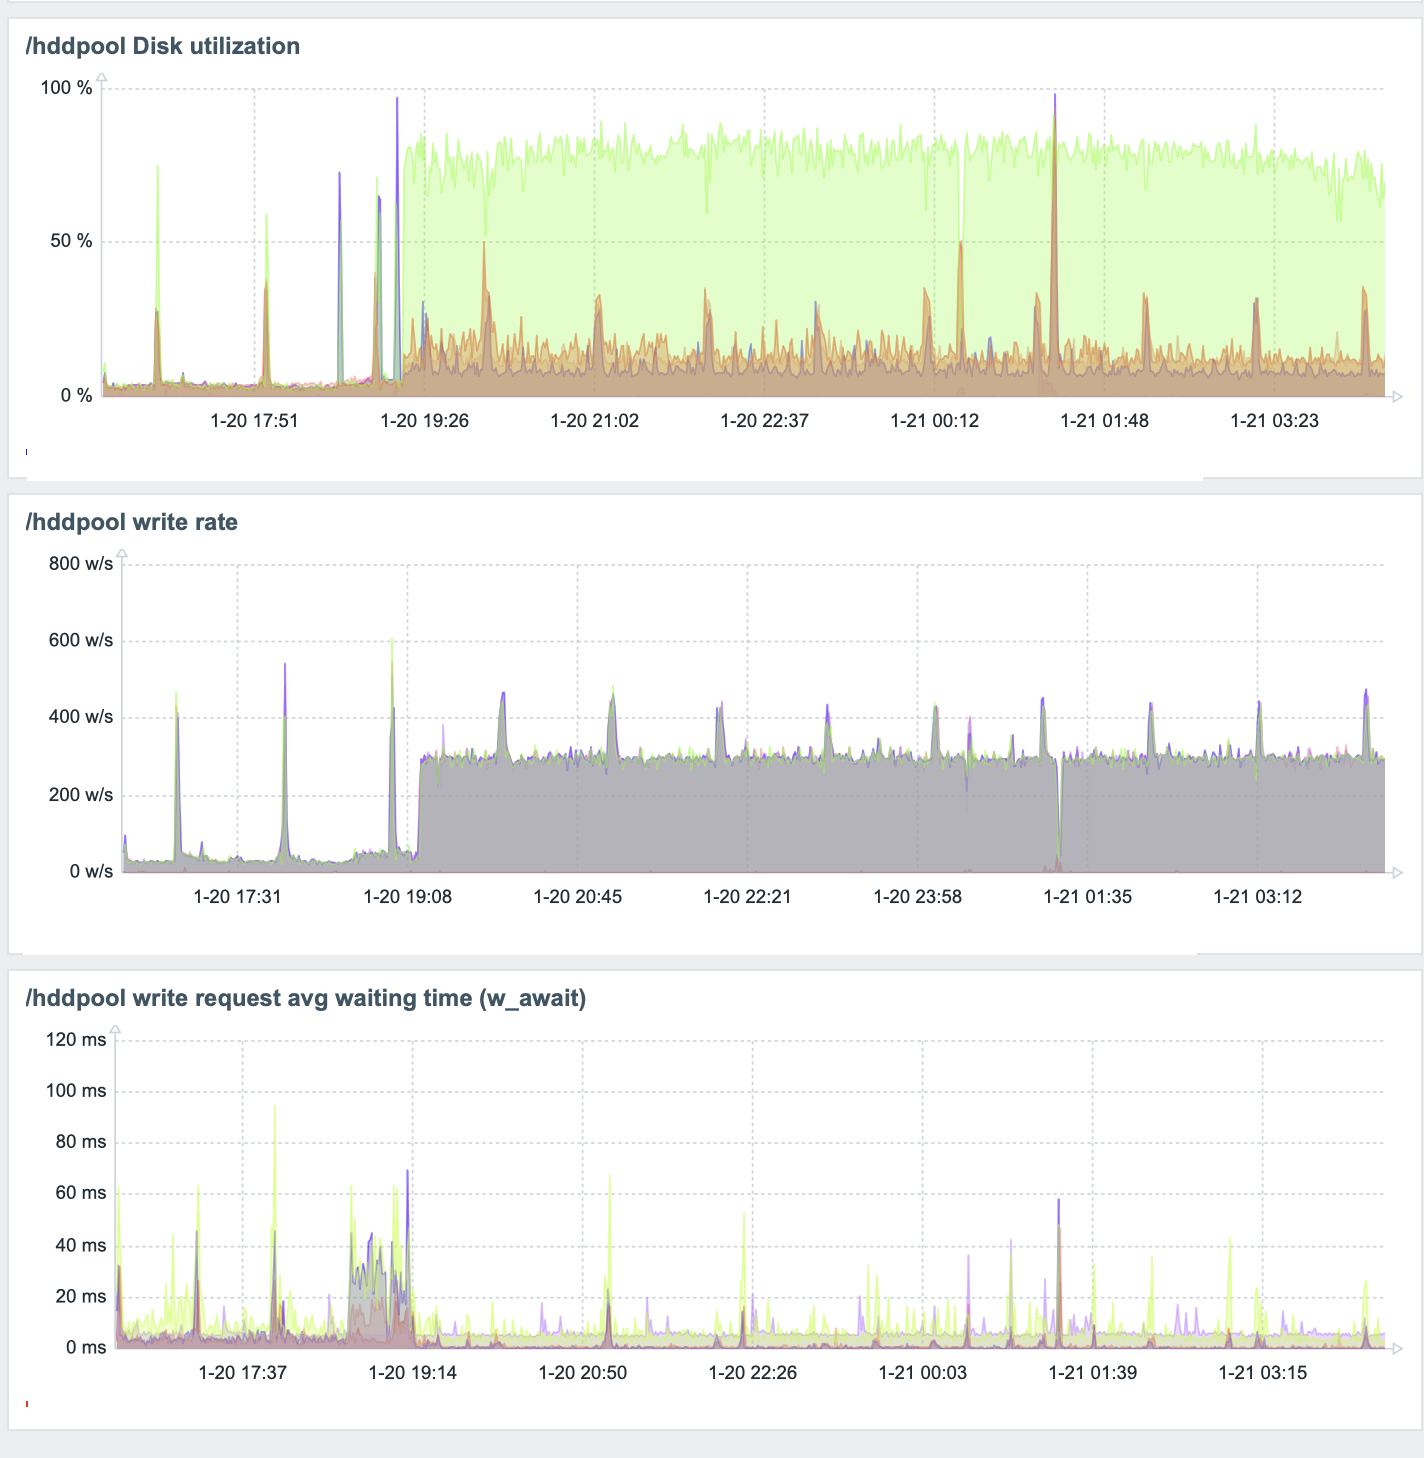
_all/_settingsは現在存在するindexに対して適用しているのが,DataStreamのようにロールオーバーした際に設定を引き継がないようだ.
kibanaからもStack Management>Index Management>Templates>Create template
からテンプレートを作成できそうなのだが選択項目た多数あってよくわかんないからRESTで情報を更新する.
curl -u <elastic_admin> -X PUT "localhost:9200/_index_template/hdd_diskusage_optim" -H 'Content-Type: application/json' -d'{
  "index_patterns": ["logs-*"],
  "data_stream": { },
  "priority": 500,
  "template": {
    "settings": {
      "refresh_interval": "60s",
      "index.merge.scheduler.max_thread_count": 1,
      "index.translog.durability": "async",
      "index.translog.sync_interval": "60s"
    }
  }
}'
これでhdd_diskusage_optimというindex templeteが作成され,新規に 作成されるlogs-* のindexに適用される(はず).とりあえず現在のindexに対して再度下記を適用して様子見をしよう.
# curl -u <elastic_admin> -X PUT "localhost:9200/_all/_settings" -H 'Content-Type: application/json' -d'
{
  "index" : {
    "refresh_interval" : "60s",
    "merge.scheduler.max_thread_count" : 1,
    "translog.durability": "async",
    "translog.sync_interval": "60s"
  }
}
'