注釈
Go to the end to download the full example code.
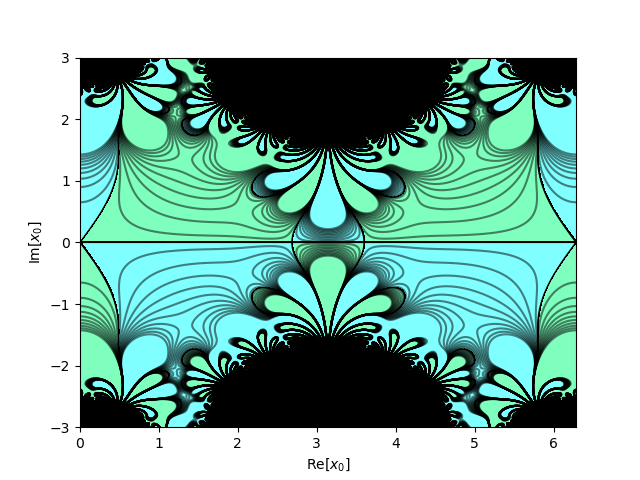
mset of the standard map#
[1]A. Shudo and K. S. Ikeda, Complex Trajectory Description for Chaotic Tunneling, Progress of Theoretical Physics Supplement 139, 246 (2000).

import numpy as np
import matplotlib.pyplot as plt

import warnings
warnings.filterwarnings('ignore')

#np.seterr(invalid='ignore')

twopi = 2*np.pi

def get_Mset(evolve, pinit, tmax, xr=[0,twopi], yr =[-3,3],sample=500):
    qr = np.linspace(xr[0], xr[1], sample)
    qi = np.linspace(yr[0], yr[1], sample)
    if yr[0]*yr[1]<0:
        qi = np.linspace(yr[0], 0, sample//2,endpoint=False)
        qi = np.append(qi, np.linspace(0, yr[1], sample//2))

    QR,QI = np.meshgrid(qr,qi)
    q0 = QR + 1.j*QI
    p0 = np.zeros(q0.shape, dtype=np.complex128) + pinit
    x = np.array([np.copy(q0), np.copy(p0)])
    initial = np.copy(q0)

    x = evolves(x, tmax, evolve)
    index = (np.abs(x[0]) > 1e100) & (np.abs(x[1]) > 1e100)
    #x[0][index] = np.nan + 1.j*np.nan
    #x[1][index] = np.nan + 1.j*np.nan
    x[0][index] = np.inf
    x[1][index] = np.inf
    prod = x[1].imag*np.roll(x[1].imag,1)
    index = (prod > 0)
    return [initial, q0[~index], x]

def plot_contour(ax,levels, init, lset):
    #vmax = lset[1][~np.isnan(lset[1])].imag.max()
    ax.contour(init.real, init.imag, lset[1].imag, levels, colors='k',alpha=0.5,lw=1)


def fmap(x, k):
    q,p = x
    p = p - np.sin(q)
    q = q + p #+ np.sin(p)
    return np.array([q, p])

def evolves(x, tmax, evolve):
    for i in range(tmax):
        x = evolve(x)
    return x

tmax = 3
k=1
evolve = lambda x: fmap(x, k)
init, mset, lset = get_Mset(evolve, 0, tmax, sample=2000)
fig, ax = plt.subplots(1,1)
ax.plot(mset.real, mset.imag, ',k')

levels = np.linspace(-2,2,20)
plot_contour(ax, levels, init, lset)

levels = [-np.inf, 0, np.inf]
colors = ["#00ff7f", "#00ffff"]
ax.contour(init.real, init.imag, lset[1].imag, levels, colors='k',linewidths=1)
ax.contourf(init.real, init.imag, lset[1].imag, levels, colors=colors,alpha=0.5, linewidths=3)

ax.set_xlabel(r"$\mathrm{Re}[x_0]$")
ax.set_ylabel(r"$\mathrm{Im}[x_0]$")

plt.show()
Total running time of the script: (0 minutes 6.448 seconds)