注釈
Go to the end to download the full example code.
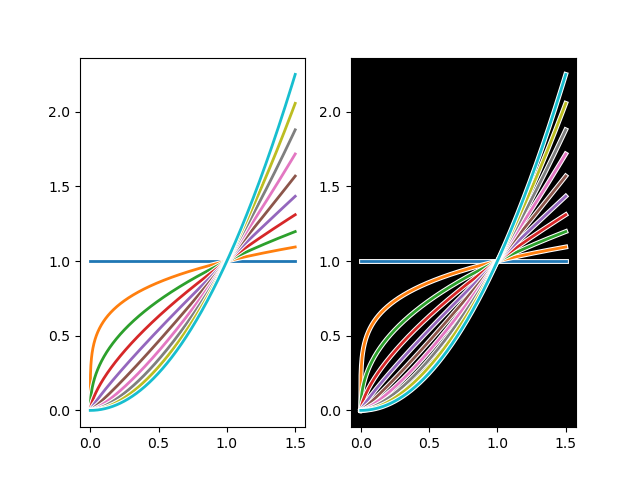
plot_line_with_edge.py#
import numpy as np
import matplotlib.pyplot as plt
import matplotlib.patheffects as patheffects


fig, ax = plt.subplots(1,2)
ax[1].set_facecolor('k')
x = np.linspace(0, 1.5, 1000)
y = lambda alpha : x**(alpha)

for alpha in np.linspace(0, 2, 10):
    lx, = ax[0].plot(x, y(alpha), lw=2)
    lx.set_path_effects([
        patheffects.Stroke(linewidth=lx.get_linewidth()+1.5, foreground="w", alpha=1),
        patheffects.Normal()
    ])

    lx, = ax[1].plot(x, y(alpha), lw=2)
    lx.set_path_effects([
        patheffects.Stroke(linewidth=lx.get_linewidth()+1.5, foreground="w", alpha=1),
        patheffects.Normal()
    ])

plt.show()
Total running time of the script: (0 minutes 0.670 seconds)