注釈
Go to the end to download the full example code.
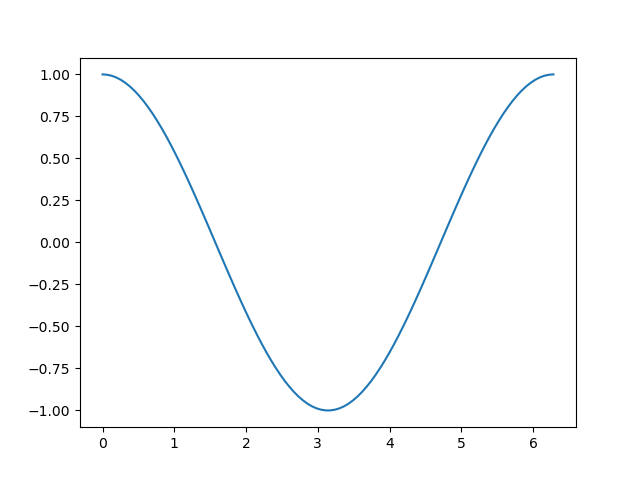
Plotting cos function#
\[x \rightarrow \cos(x)\]
import numpy as np
import matplotlib.pyplot as plt

fig, ax = plt.subplots(1,1)
x = np.linspace(0, 2*np.pi, 100)
y = np.cos(x)
ax.plot(x,y)
plt.show()
Total running time of the script: (0 minutes 0.062 seconds)