注釈
Click here to download the full example code
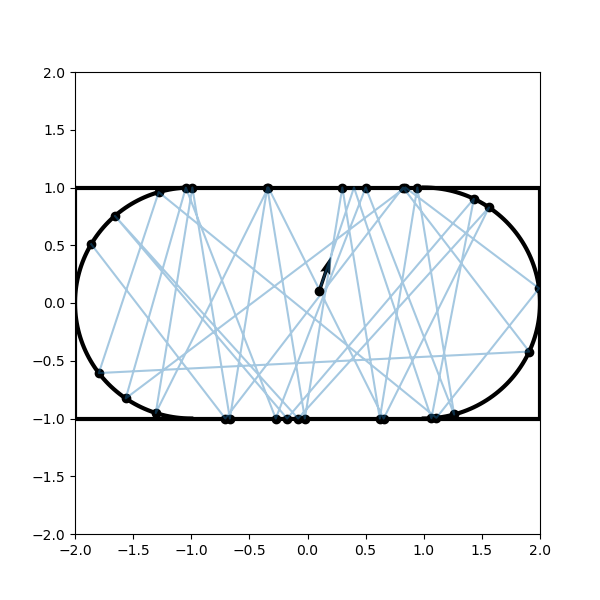
(classical) stadium billiard
import numpy as np
import matplotlib.pyplot as plt
from scipy import optimize


fig, ax = plt.subplots(1,1, figsize=(6,6))

theta1 = np.linspace(-np.pi/2, np.pi/2, 100)
z1 = np.exp(1j*theta1) + 1

theta2 = np.linspace(np.pi/2, 3*np.pi/2, 100)
z2 = np.exp(-1j*theta2) - 1

x = np.array([-2, 2, 2, -2, -2])
y = np.array([1, 1, -1, -1, 1])

ax.plot(z1.real, z1.imag, '-k', lw=3)
ax.plot(z2.real, z2.imag, '-k', lw=3)
ax.plot(x, y, '-k',lw=3)

ax.set_ylim(-2,2)
ax.set_xlim(-2,2)

def semi_cf(z, a, c, x0, y0):
    x,y = z
    return [(x - c)**2 + y**2 - 1,
            y - a*(x - x0) - y0]

def circ_df(z, c):
    x, y = z
    return np.array([ 2 * ( -c + x ), 2 * y])

def rect_intersection(vec0, coord):
    a = vec0[1]/vec0[0]
    x0,y0 = coord
    sg = np.sign(vec0[1])
    x1 = - ( - sg - a*x0 + y0 ) / a
    y1 = sg
    if x1 > 1.0:
        f = lambda x: semi_cf(x, a, 1, x0, y0)
        res = optimize.root(f, [x1, y1])
        x1, y1 = res.x
    elif x1 < -1.0:
        f = lambda x: semi_cf(x, a, -1, x0, y0)
        res = optimize.root(f, [x1, y1])
        x1, y1 = res.x
    return np.array([x1, y1])

def df_rect(x0):
    x,y = x0
    if np.abs(np.abs(y) - 1) < 1e-10:
        z = np.array([0, -1])
    elif np.abs(np.abs(x) - 2) < 1e-10:
        z = np.array([-1, 0])
    return z

def df(x0):
    x,y = x0
    if np.abs(x) < 1:
        return df_rect(x0)
    elif x > 0:
        return circ_df(x0, 1)
    elif x < 0:
        return circ_df(x0, -1)
    else:
        print("something wrong")


def intersection(vec0, coord):
    x, y = coord
    #if np.abs(x) < 1:
    return rect_intersection(vec0, coord)

traj = [np.array([]), np.array([])]

x0 = np.array([0.1, 0.1])
vec0 = np.array([0.05, 0.15])
init_x = x0.copy()
init_vec = vec0.copy()

traj[0] = np.append(traj[0], x0[0])
traj[1] = np.append(traj[1], x0[1])

x1 = intersection(vec0, x0)

traj[0] = np.append(traj[0], x1[0])
traj[1] = np.append(traj[1], x1[1])


n = df(x1)
pn = - np.dot(vec0, n)/np.dot(n, n) * n
vec1 = vec0 + 2*pn

#ax.quiver(x1[0], x1[1], n[0], n[1], angles='xy', scale_units='xy', scale=5)
#ax.quiver(x1[0], x1[1], vec1[0], vec1[1], angles='xy', scale_units='xy', scale=1/2)

for i in range(30):
    x0 = x1.copy()
    vec0 = vec1.copy()

    x1 = intersection(vec0, x0)
    ax.plot(x1[0], x1[1], 'ok')

    traj[0] = np.append(traj[0], x1[0])
    traj[1] = np.append(traj[1], x1[1])

    n = df(x1)
    pn = - np.dot(vec0, n)/np.dot(n, n) * n
    vec1 = vec0 + 2*pn

    #ax.quiver(x1[0], x1[1], n[0], n[1], angles='xy', scale_units='xy', scale=5)
    #ax.quiver(x1[0], x1[1], vec1[0], vec1[1], angles='xy', scale_units='xy', scale=1/2)

ax.plot(traj[0], traj[1], '-',alpha=0.4)
ax.plot(init_x[0], init_x[1], 'ok')
ax.quiver(init_x[0], init_x[1], init_vec[0], init_vec[1], angles='xy', scale_units='xy', scale=1/2)

plt.show()
Total running time of the script: ( 0 minutes 0.276 seconds)