注釈
Go to the end to download the full example code.
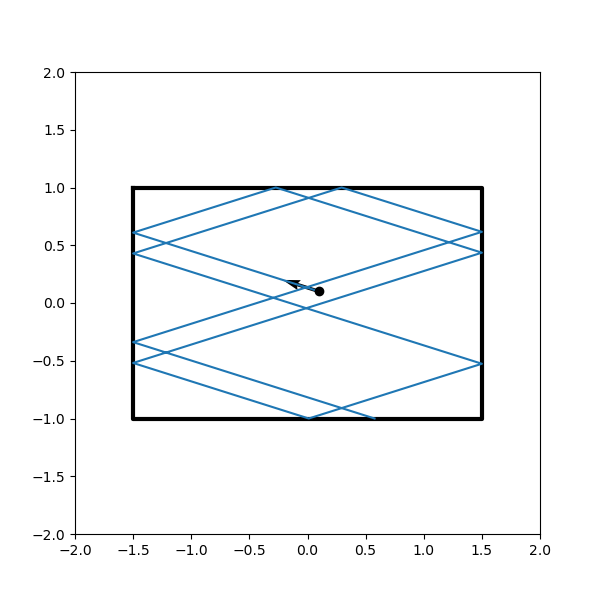
rectangular billard#
import numpy as np
import matplotlib.pyplot as plt

fig, ax = plt.subplots(1,1, figsize=(6,6))

x = np.array([-3/2, 3/2, 3/2, -3/2, -3/2])
y = np.array([1, 1, -1, -1, 1])

ax.plot(x, y, '-k', lw=3)
ax.set_ylim(-2,2)
ax.set_xlim(-2,2)

def intersection(vec0, coord):
    a = vec0[1]/vec0[0]
    x0 = coord[0]
    y0 = coord[1]
    sg = np.sign(vec0[1])
    x1 = - ( - sg - a*x0 + y0 ) / a
    y1 = sg

    if np.abs(x1) >  3/2:
        sg = np.sign(vec0[0])
        x1 = sg*3/2
        y1 = (sg*3*a - 2*a*x0 + 2*y0)/2

    return np.array([x1, y1])

def df(x0):
    x = x0[0]
    y = x0[1]

    if np.abs(np.abs(y) - 1) < 1e-10:
        z = np.array([0, -1])
    elif np.abs(np.abs(x) - 3/2) < 1e-10:
        z = np.array([-1, 0])

    return z


traj = [np.array([]), np.array([])]

x0 = np.array([0.1, 0.1])
vec0 = np.array([-np.pi/10, 0.1])

init_x = x0.copy()
init_vec = vec0.copy()

traj[0] = np.append(traj[0], x0[0])
traj[1] = np.append(traj[1], x0[1])

x1 = intersection(vec0, x0)

traj[0] = np.append(traj[0], x1[0])
traj[1] = np.append(traj[1], x1[1])

n = df(x1)
pn = - np.dot(vec0, n)/np.dot(n, n) * n
vec1 = vec0 + 2*pn

#ax.quiver(x1[0], x1[1], n[0], n[1], angles='xy', scale_units='xy', scale=1)
#ax.quiver(x1[0], x1[1], vec1[0], vec1[1], angles='xy', scale_units='xy', scale=1)

for i in range(10):
    x0 = x1.copy()
    vec0 = vec1.copy()
    x1 = intersection(vec0, x0)

    traj[0] = np.append(traj[0], x1[0])
    traj[1] = np.append(traj[1], x1[1])

    n = df(x1)
    pn = - np.dot(vec0, n)/np.dot(n, n) * n
    vec1 = vec0 + 2*pn


    #ax.quiver(x1[0], x1[1], vec1[0], vec1[1], angles='xy', scale_units='xy', scale=1)

ax.plot(traj[0], traj[1], '-')
ax.plot(init_x[0], init_x[1], 'ok')
ax.quiver(init_x[0], init_x[1], init_vec[0], init_vec[1], angles='xy', scale_units='xy', scale=1)

plt.show()
Total running time of the script: (0 minutes 0.042 seconds)