注釈
Go to the end to download the full example code.
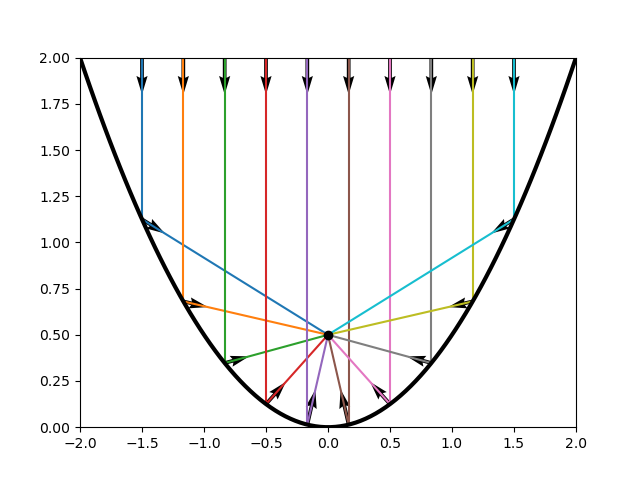
parabolic reflector#
import numpy as np
import matplotlib.pyplot as plt

fig, ax = plt.subplots(1,1)


def y(x):
    return x**2/2

def df(x,y):
    return np.array([-x, 1])

#x0 = 1.5
for x0 in np.linspace(-1.5,1.5,10):
    y0 = 2
    i = np.array([0,-0.2])
    n = df(x0, y(x0))
    pn = -np.dot(i, n)/np.dot(n, n) * n
    o = i + 2*pn
    sample = 2
    line = [np.array([x0]*sample), np.linspace(y(x0),2,sample)]
    if x0 < 0:
        x = np.linspace(x0,0,2)
    else:
        x = np.linspace(0,x0, 2)
    z  = o[1]/o[0]*(x-x0) + y(x0)
    l, = ax.plot(line[0], line[1], '-')
    ax.quiver(x0, y0, i[0], i[1], angles='xy', scale_units='xy', scale=1)
    ax.quiver(x0, y(x0), o[0], o[1], angles='xy', scale_units='xy', scale=1)
    ax.plot(x, z, '-',c=l.get_color())

x = np.linspace(-2,2,100)
ax.plot(x, y(x), '-k',lw=3)
ax.plot(0, 0.5, 'ok')

ax.set_ylim(0,2)
ax.set_xlim(-2,2)
plt.show()
Total running time of the script: (0 minutes 0.072 seconds)