注釈
Go to the end to download the full example code.
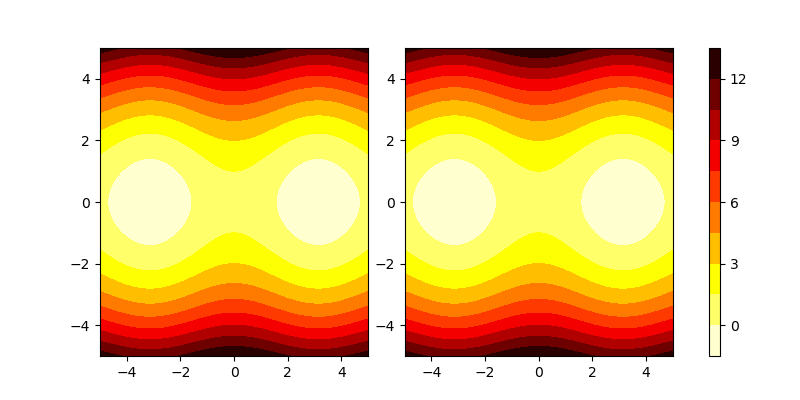
multiple contourf plots with colorbar1#
import numpy as np
import matplotlib.pyplot as plt

kw = {"width_ratios":[50,50,2]}
fig, ax = plt.subplots(1,3,  gridspec_kw=kw,figsize=(8,4))

x = np.linspace(-5,5,1000)
y = np.linspace(-5,5,1000)
x,y = np.meshgrid(x,y)

H = lambda q,p: p**2/2 + np.cos(q)

ax[0].contourf(x,y, H(x,y), 10, cmap=plt.cm.hot_r)
cf=ax[1].contourf(x,y, H(x,y), 10, cmap=plt.cm.hot_r)
fig.colorbar(cf, cax=ax[2])
plt.show()
Total running time of the script: (0 minutes 1.061 seconds)