注釈
Go to the end to download the full example code.
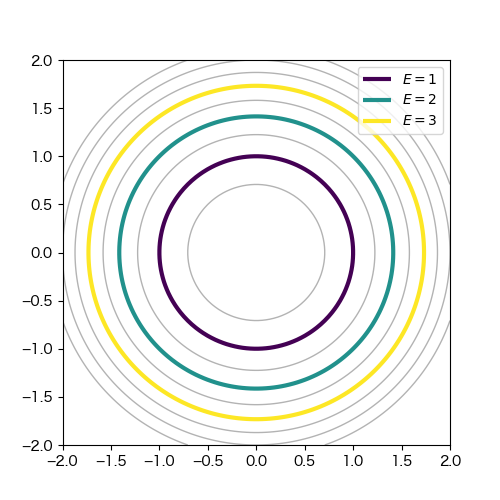
contour plots with a label for pecific levels#
import matplotlib.pyplot as plt
import numpy as np

fig, ax = plt.subplots(1,1, figsize=(5,5))

x0 = np.linspace(-2,2,100)
y0 = np.linspace(-2,2,100)
x,y = np.meshgrid(x0,y0)

levels=np.arange(0,5,0.5)
ax.contour(x, y, x**2 + y**2, levels, colors="0.7", linewidths=1)
cs = ax.contour(x, y, x**2 + y**2, [1,2,3],linewidths=3)
l = [r'$E=1$', r'$E=2$', r'$E=3$']
handles, labels = cs.legend_elements()
ax.legend(handles, l)

plt.show()
Total running time of the script: (0 minutes 0.129 seconds)